Data Discovery - Amplified
Drowning in a pool of complex data? Bringg can help you stay afloat!
Our robust analytics widgets, dashboards, and reports make it quick and easy for you to monitor your KPIs and make adjustments to your operations that directly impact your bottom line.
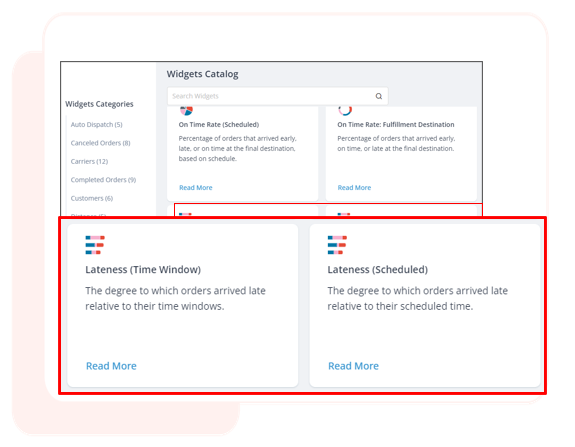
Zoom in with New Widgets
Your analytics need to be as multifaceted as your business. So Bringg has enriched our widget catalog so you can now:
- Check numbers of active drivers, vehicles, and teams to ensure maximal utilization of your resources.
- Evaluate on time rates and degree of lateness relative to an order’s scheduled time or time window.
- Check the delivery costs per route, day, and order.
- Understand the timing of each stage of an order life cycle, from creation to fulfillment.
- Analyze the reasons why orders were canceled to identify problematic patterns.
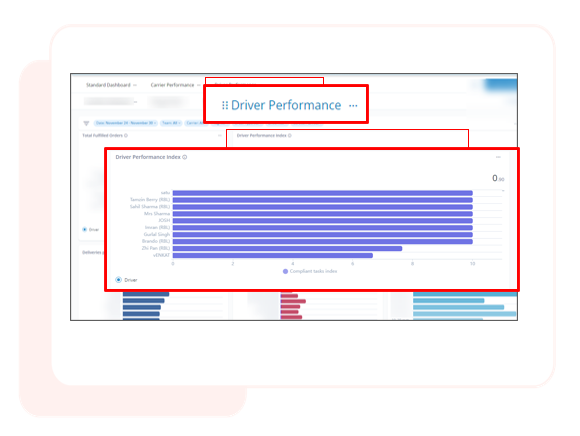
Make it Easy with Ready Dashboards
Make sure your drivers and carriers are meeting their KPIs, complying with company standards, and maximizing efficiency with our pre-configured driver and carrier performance dashboards. Learn more.
Each dashboard comes with a collection of pre-assigned widgets reflecting the data you commonly need, including:
- Deliveries per hour
- CSAT score breakdowns
- Each driver’s overall performance index
- Numbers of successfully delivered orders
- Rate at which drivers deliver orders on time, early, and late
- Time on site at the fulfillment destination
- The frequency and timing of order cancellations
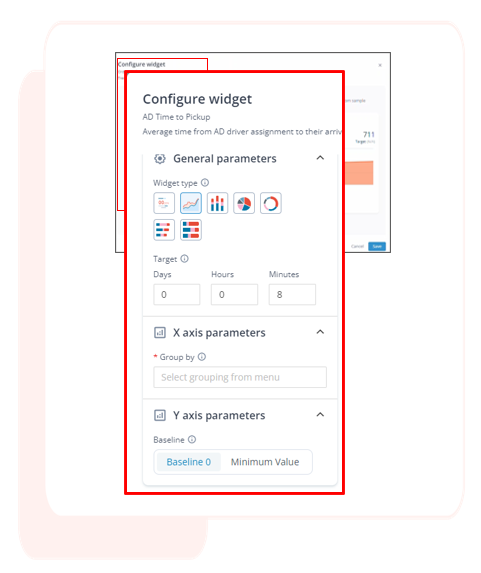
Tweak Widgets
Control how you and your colleagues see data with customizable widgets. Name, filter, and visualize them in whatever ways make sense for your business. For example, compare late orders at pick up versus drop off, or have sets of widgets on a single dashboard, each one focusing on a different team you manage. Learn more.
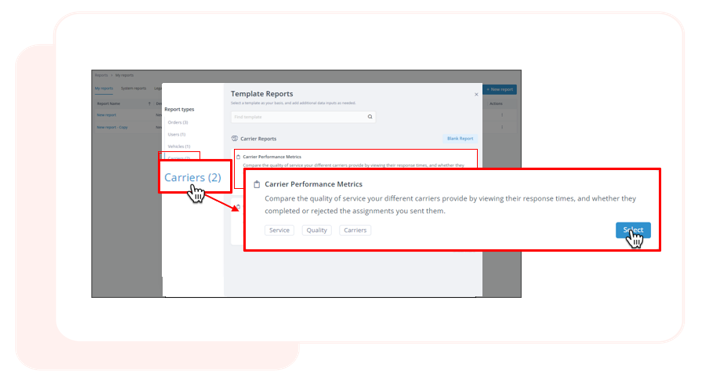
If There's No Report, it Didn't Happen
For any hungry innovator, robust reports are your bread and butter. Without them, it’s hard for your ideas to grow or your business to thrive. Bringg’s newest enhancements to the report builder help ensure your appetite for success is properly nourished. Learn more.
Updates include:
- The Automated Workflows system reports to view all executed automations by date and time.
- Carrier-based reports to better evaluate performance.
- A DPH column you can add to order reports that measures your deliveries per hour.
- For example, set a webhook to fire when orders are late, triggering another system to place a phone call, email, or SMS to each affected customer. Or send another when an order is updated to require installation, notifying the dispatcher to assign the right kind of driver.
Coming Soon...
Mass uploads of service areas - Save time setting up your service areas in Bringg by uploading them all together.
Update Multiple Delivery Slots at Once - Make changes that apply to as many delivery slots as you choose.
Visit our blog