Edit Widgets
- 16 Apr 2024
- 4 Minutes to read
- Print
- DarkLight
Edit Widgets
- Updated on 16 Apr 2024
- 4 Minutes to read
- Print
- DarkLight
Article Summary
Share feedback
Thanks for sharing your feedback!
You can control your data analysis by configuring widget metrics in the analytics dashboard to suit your company's unique terminology, use cases, and operational needs. Sort, filter, and visualize data according to the insights you need to make critical decisions about orders in real time.
For example, you can make a terminology change like changing the widget called Total Order Price to say Total Call Price if you refer to orders as calls. Or you can use more complex configurations by adding multiple instances of the same metric to a single dashboard, and setting each one to reflect the specific data you want to see. For example, you can set one Canceled Orders widget to be grouped by carrier to compare their cancellation rates, and another by the day of the week in order to understand cancellation patterns based on timing.
.png) Customize your widgets to fit your needs
Customize your widgets to fit your needs
Before You Begin
- Confirm you have a user of type Admin or Dispatcher
- Add the widgets you want to include in your analytics dashboard. Learn more.
Procedure
Step 1: Choose the specific dashboard you want to adjust by selecting its tab.
Step 2: In Analytics > BI Dashboard, select Edit.
Step 3: Choose the widget(s) you wish to configure from your dashboard.
Select the horizontal menu ![]() of the widget, and choose Edit from the menu.
of the widget, and choose Edit from the menu.
Alternatively, you can edit a new widget directly from the catalog.
.png) Edit a widget
Edit a widget
Note
Different types of widgets have different configuration fields available. For example, a metric like Rate of Carrier Availability, which automatically groups data by carrier, does not support a pie chart visualization. Similarly, you cannot configure a target for pie charts, though you can for line and bar charts since the target sits on an axis.
Step 4: Configure the widget according to your use case.
For example, you can set the On Time Delivery Rate widget to a reverse bar chart and then group the data by carrier. Then you can add a duplicate widget, and group it instead by date so that you can see the distributions of data in parallel and better understand if and why there are delays.
| To... | Do this... |
|---|---|
| Customize the title or description of the widget. | Hover over the relevant text and click on the edit icon to make changes. icon to make changes.For example, rename the Order Distance widget to specify pick-up. Then duplicate the widget on your dashboard, but rename it to include drop-off. Tip The analytics dashboard preserves the original widget name and description for your reference. |
| Choose the kind of visualization you wish to use to display your data. | Select a Widget type from the menu. For example, use a whole number widget if you simply want to show the total orders fulfilled. Or use a bar chart to compare the same results according to different dates, drivers, carriers, and so on. 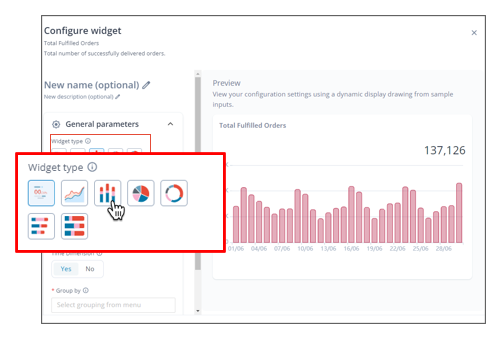 Select a visualization for your widget Select a visualization for your widget
Note Different visualizations offer different types of configuration capabilities. For example, when using a whole number, line, or bar chart, you can set a target. But only in line or bar charts can you configure elements of the X or Y axis. |
| Evaluate your KPIs relative to a benchmark. | (Line charts, bar charts, or whole numbers only) Enter a numerical value as your target. For example, set a benchmark of the amount of orders you want to fulfill per hour, and then check the results against that goal to evaluate success. If the widget measures duration, you may be asked to enter the number of days, hours, and minutes as your target.
.png) Define your benchmark Define your benchmark
The target line is displayed on the chart itself.
.png) Compare benchmark with results Compare benchmark with results
|
| Organize your data according to a time grouping, and choose whether to compare equal buckets of time to one another. | (Line and bar charts only)
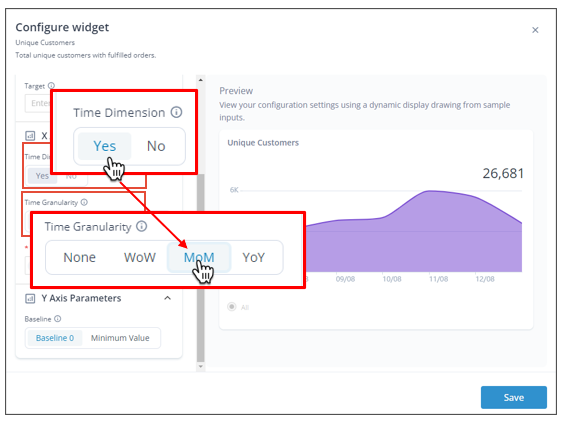 Choose whether to view or compare your data based on periods of time Choose whether to view or compare your data based on periods of time
|
| Organize your data by groups like Tags, Teams, or Order Types. |
For example, compare the number of fulfilled orders each team completed each day by first grouping them according to the day of the week, and then stacking them by team. 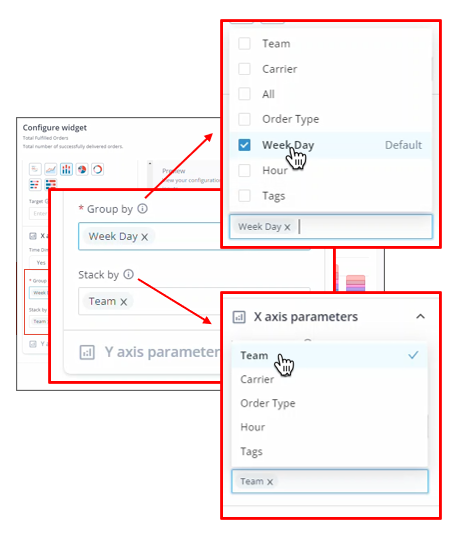 Select how you want to group your data Select how you want to group your data
Note If using a bar chart without activating Time Dimension, you can group by day or hour. |
| Define the lower limit of your y axis. | (Line charts only) Choose a Baseline. You can either:
Or, to compare the average order duration from when an order is created to when it is fulfilled, set the y axis to begin from 10 minutes if that's the least amount of time a fulfillment process can take. 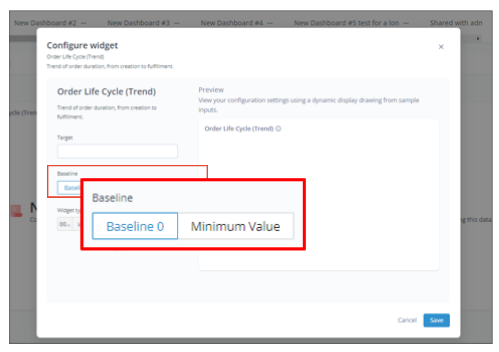 Select your baseline Select your baseline
|
Step 5: Select Save to preserve your changes, or Cancel to discard them.
Saved changes display in your dashboard.
Was this article helpful?