Leverage the data that you own in Delivery Hub to improve the performance of your fulfillment operations. In Delivery Hub's Report Builder, you can prepare, schedule, and share reports with all the data that you need to perform your own analysis and make strategic decisions.
You can use a template report out of the box, or customize it by adding and adjusting fields. For example, you can tailor a report to gather data for a specific theory that you are testing or create lists of expenses to share with your accounting department.
When you generate a report, Delivery Hub populates the table with live data from the database. You can use the table to juxtapose different data points and pinpoint patterns of behavior.
For example, you can compare the carrier rates for shipments to a specific region. To put your analysis into action, you could then create a shipping rule to prioritize the cheaper carrier for that specific region. You could also compile a list of unassigned shipments to look for common roadblocks, or simply print a list of all shipments that are currently in the Ready to Ship status.
Before You Begin
Confirm you have the Admin user type.
- (Optional) Create a theory that you would like to prove using your Delivery Hub data. For example, you may want to prove that a change in shipping rules speeds the delivery process for a specific region.
- Determine what each row should represent. This is usually identifying information, such as a shipment ID or carrier name.
- Determine the aggregate measurements you want to see for each row. For example, if you want to see how many shipments each carrier delivered in a specific week, you would select the Total delivered shipments measurement as one of the columns in your table.
Create or Edit a Report
You can create a new report or edit an existing report or template.
| To... | Do this... |
|---|---|
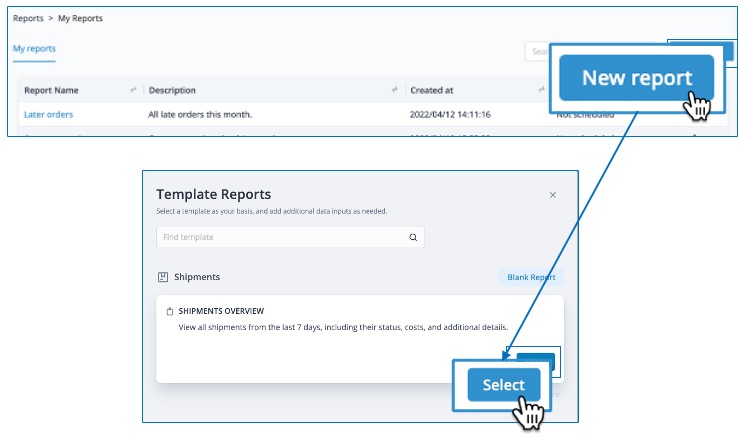
| Customize a template report | 1. Select My Reports > New Report. 2. Choose a template report that includes at least some of the data fields you need by hovering over the template and selecting Select.
|
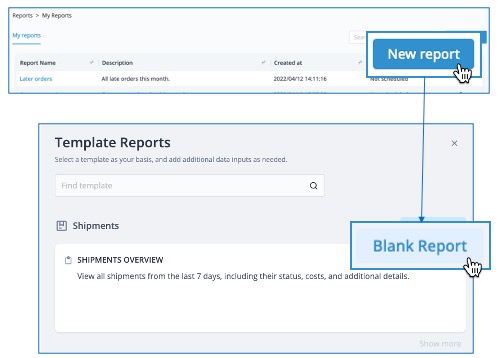
| Create a report from scratch | 1. Select My Reports > New Report. 2. Select Blank Report to open the report builder.
|
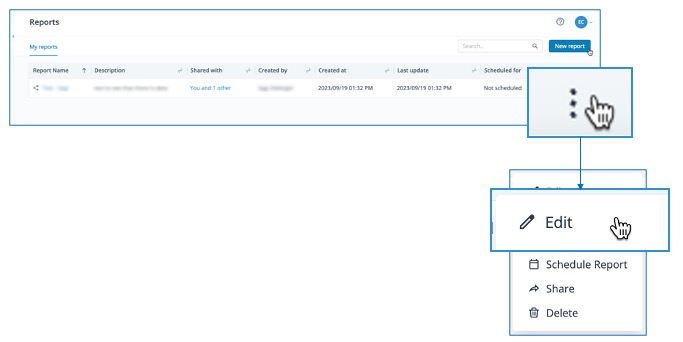
| Revise an existing report | Select My Reports, open the context menu next to the report you want to duplicate, then select Edit.
|
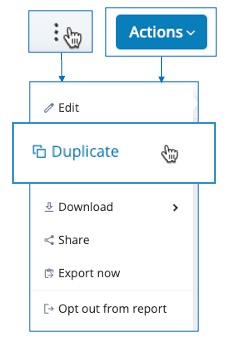
| Duplicate an exisiting report | In My Reports, select the context menu next to the report you want to duplicate, then select Duplicate. Alternatively, you can select Duplicate from inside an opened report. The duplicate copy appears below the original in your reports list.
|
Add Data Fields
Choose data fields to add as table columns by selecting corresponding fields from the list of database fields. You can find fields using the search bar, or by expanding the the list to view all options.
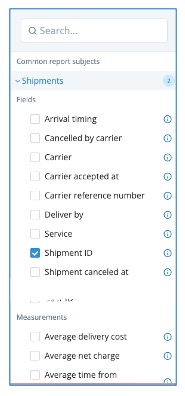
The leftmost column defines the content for each row. For example, selecting shipment status for this column display a single status in each row, while selecting Shipment ID displays a single shipment in each row.
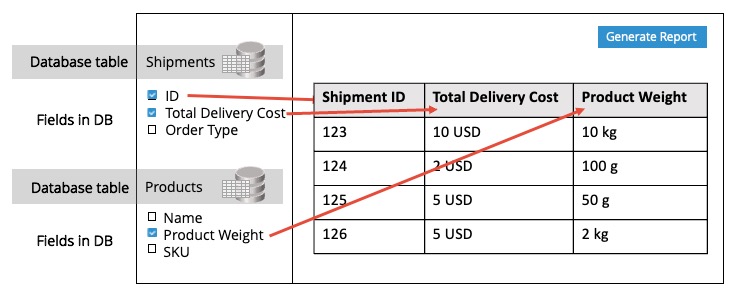
Be sure to include at least one field from the main table associated with the kind of report you are building. For example, if you are building a report about shipments, use at least one field from the Shipments table.
To load data in your report, select Run. Select Save to store your report so you can rerun it at a later date. Bringg stores all your custom reports under My Reports.
Customize your Report
Customize your report by assigning an identifying, title, adding a description, or adjusting the position of the columns.
| To... | Do this... |
|---|---|
| Change the title and description of your report | Select the edit  icon next to the report title or description to enter text. icon next to the report title or description to enter text. |
| Rearrange the report columns | Hover over a column, select the  icon and drag it to a different position. icon and drag it to a different position. |
| Remove a column | Hover over the column title then select  , or deselect the column's database field from the list. , or deselect the column's database field from the list. |
| Change a column heading in your data table | Hover over the column, select the edit icon, and enter the new column name. |
| Sort the report by a specific column | Once you have populated the data table by selecting Run, hover over the column header and select the sort icon  . . |
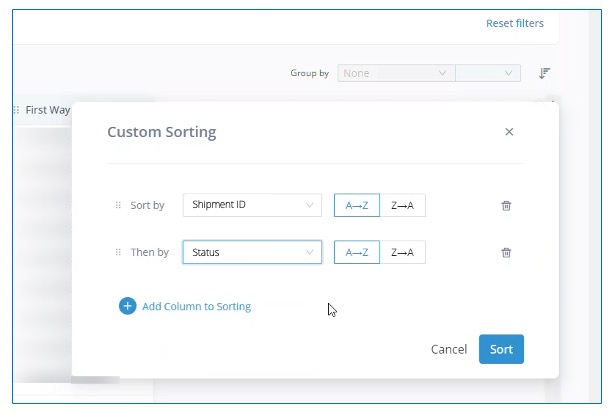
| Sort the report by multiple criteria | Once you have populated the data table by selecting Run, select the custom sorting icon  and select Add Column to Sorting. Once you add columns you can reorder them as necessary. and select Add Column to Sorting. Once you add columns you can reorder them as necessary.
|
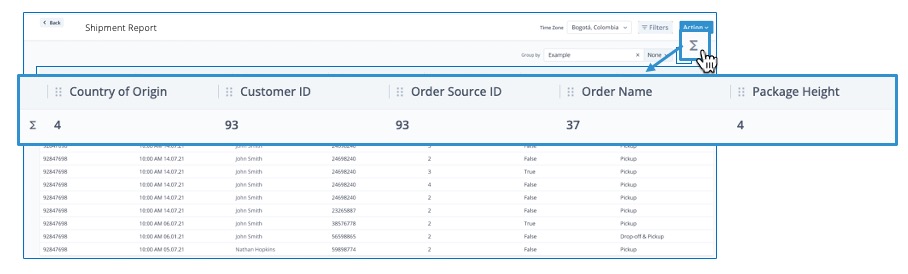
| View a summary of the data inputs, for example the number of unique carrier services listed in a report | To add a summary row with the count of unique items in each column, select the summary icon
|
| (Coming soon) Aggregate individual data points into an average over a time period | Select an option from the Group by dropdown list. This requires at least one of the columns in the report to be a date or time period. |
Filter Report Data
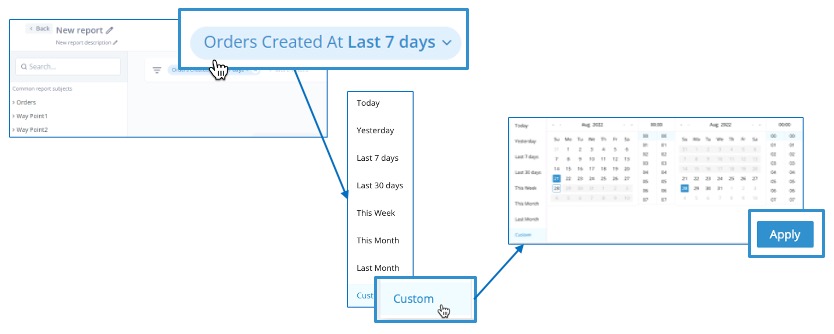
You can adjust the time frame for your report query and focus your data to reduce distraction.
Filter by time frame
To filter by time frame, expand the filters bar, then select More Filters, select a field from the Times Filters list in the dropdown, then select a timeframe.
To protect the privacy of your organization and consumers, Bringg stores personal identification information (PII) data related to orders for 90 days back from the current date, depending on whether you are viewing a legacy report or using the report builder. However, anonymized data remains in the system to use for the purpose of data and analytics for a period of six months.
Focus Your Data
To focus on a specific data set, such as only shipments fulfilled by a specific shipping location, expand the filters bar, select More Filters, choose a data field, and then choose which inputs you want to view. Then, select Apply.
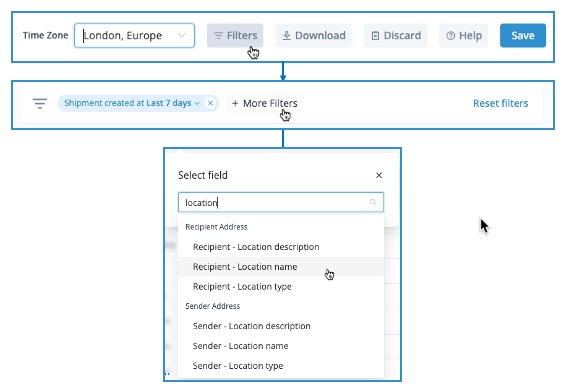
Filter by any data field
Once you include at least one field from a certain database table, you can filter your report by any other field in that table, even if the field is not included as a column in your report.
Download a Report
Download a report to extract actionable insights by selecting the report from the My Reports list, then selecting Download and choosing a file format. You can then import your CSV or JSON file to an external system to analyze your data.
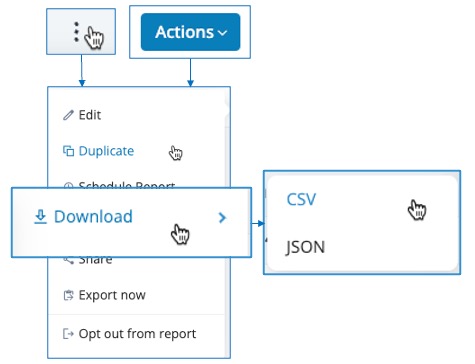
Confirm the report is populated with data for the required time frame and you applied the correct filters before downloading the report.
You can also share reports directly with colleagues on a regular basis, for example as weekly reports, or merge your data with other sources to reach further insights.
Delete a Report
To delete a report, select My Reports. Select the context or Actions menu ![]() of the report you want to delete, and select Delete.
of the report you want to delete, and select Delete.