Delivery Hub's analytics dashboard offers live monitoring of your KPIs with rich graphical widgets, giving you at-a-glance access to your data. You can use this data to improve efficiencey, save money, and enrich reports to executives. For example, you can compare delivery times between different carriers, then filter your results by recipient location to find the most efficient carrier for each region.
You can also customize the analytics dashboard so the information you access most frequently is front and center. Create and manage multiple dashboards in separate tabs, selecting relevant widgets for each from the widgets catalog. You can duplicate dashboards and adjust for different purposes, resize and reposition widgets, and remove the ones you no longer need. Then share dashboards with colleagues so they can stay updated.
For example, create one dashboard for widgets that monitor carrier efficiency for a particular location. Then duplicate and adjust the widgets to monitor the carriers for another location. Share each dashboard with admins from each location so they can adjust carrier assignment and shipping rules as needed.
Before You Begin
- Determine what KPIs you want to measure, how you want to see them, and with whom you want to share your dashboard.
Access the Dashboard
To access the analytics dashboard, select BI Dashboard from the navigation menu.
New dashboards currently feature a number of default widgets so you can quickly view your data and how they compare to your KPIs.
Filter to View Specific Data Sets
You can filter each dashboard to view the most relevant data for your needs. Select Filters to view filtering options.
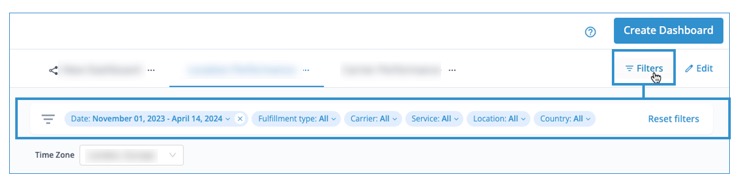
Filter and compare data
Filter and compare time frames
Compare data over a certain time frame to another time frame of equal duration by activating the Compared to toggle and selecting a parallel time frame.
For example, compare data from the current holiday season to the same dates in the previous year to see how your strategy for fulfilling orders during the holiday season has improved.
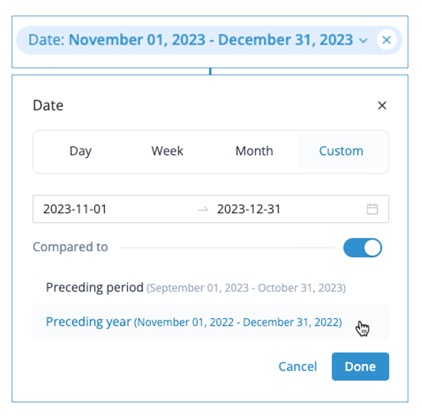
Compare to a previous timeframe
You can also filter your data by the following fields:
- Carrier
- Date
- Country (sender or recipient)
- Location (sender or recipient)
- Fulfillment method (direct or PUDO)
- Fulfillment type (delivery or return)
- Service
- Shipping Account
- Status
To declutter your screen, you can hide the filters by reselecting Filters.
Customize a Dashboard
To access the Dashboard's customization options, select Edit. Once you have made your changes, select Save Changes or select Cancel to return to the regular dashboard screen.
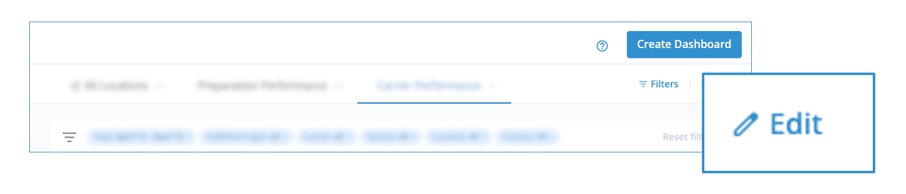
Select Edit to configure your dashboard
Rename a dashboard
To rename a dashboard, select the edit icon  that appears when you hover over the name of a dashboard, then enter the new name.
Edit a widget
You can customize the data and visualization for each widget to suit your use case. To do so, select the context menu  > Edit. Learn more about editing widgets.
Resize a widget
To resize a widget, select and hold the lower right corner of the widget, then drag up or down until you are satisfied with the widget's size.
Reposition a widget
To reposition a widget, select any part of the widget (except for the resizing arrow) and drag to your preferred location.
When you resize or reposition widgets, the surrounding widgets move to make room for them. You can continue rearranging until you are happy with the size and location of each widget.
Remove a widget
To remove a widget from your dashboard, select the widget's context menu > Delete.
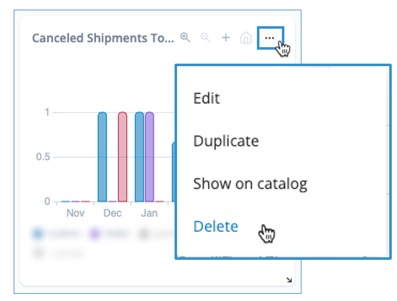
Remove a widget from your dashboard
Remove a dashboard
To remove a dashboard that you no longer need, select the dashboard context menu that is located on the dashboard tab, then select Remove.
Add Widgets from the Catalog
To add new widgets to the dashboard, select + Widget to open the catalog, then select a topic from the list or enter a keyword into the search bar to find relevant widgets.
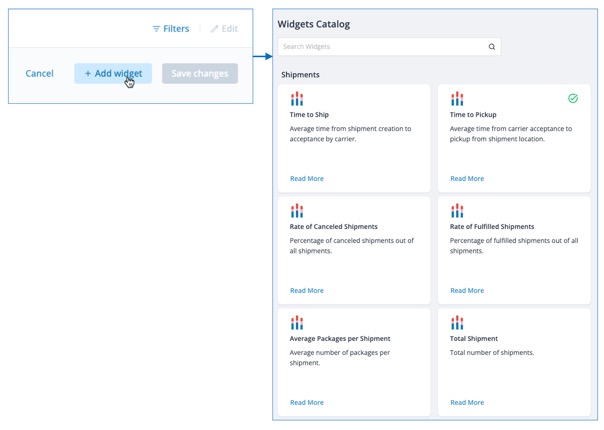
Select Add Widgets to open the widget catalog
You can read about how specific widgets are calculated and used by selecting Read More on the widget's catalog card. You can always access this information again once a widget is in the dashboard by hovering over the widget's info ![]() icon.
icon.
Navigate Within a Widget
You can navigate within a widget to see more data.
- Select zoom in
 or out
  for a more granular or broad view of your data.
 - Select pan
 to scroll left or right through zoomed data.
 - Select plus
 to zoom in on a particular area of your data.
 - Select home
 to reset the widget to its original visibility.
Take a Data Snapshot
To save the data as it is represented in a widget, select the context menu then select Download PNG or Download CSV.
Create Additional Dashboards
You can create additional dashboards to track different types of data or focus on specific priorities. For example, create one dashboard to monitor operational efficiency for a particular shipping location. Then duplicate the dashboard and adjust the widgets to monitor similar metrics for another location.
New dashboards appear in separate tabs on your dashboards screen.
Duplicate a dashboard
To duplicate a dashboard, select the context menu > Duplicate.
Create a new dashboard
To create a new dashboard, select Create and then choose from the available templates or select Build Your Own to create one from scratch.
Reorganize the dashboard tabs as you wish by selecting the gripdots  of a dashboard tab, and dragging it to the location you prefer.
Share a Dashboard
Share a dashboard with colleagues by selecting the context menu > Share.
You can define what level of editing or viewing permissions you want to give each user.
For example, you can share view-only dashboards that contain widgets tracking carrier on-time rates with users who have the Packer role.